

Spin-offs are one of the few corners of the market where a structural, non-economic force reliably creates mispricing, and it has nothing to do with the business itself. When a company spins off a division, the new shares land in the portfolios of investors who never chose to own them. A shareholder of the parent bought that stock for its original business, like its index membership, its sector exposure, or its dividend profile, and suddenly finds a smaller, differently-shaped company sitting in their account that doesn’t fit any of those mandates. Index funds tracking the parent’s benchmark are often forced sellers, since the spin-off frequently doesn’t qualify for the same index. Institutional funds with strict market-cap or sector mandates face the same problem.
None of these sellers are judging the spin-off’s quality; they’re selling because they have to, not because they’ve concluded the business is worth less than the market says. That’s the gap value investors live for: price movement driven by structural indifference rather than analysis.
This is precisely why spin-offs have quietly built one of the best track records in corporate finance. The seminal research on the subject (Joel Greenblatt popularized much of it in “You Can Be a Stock Market Genius”) shows spin-offs have historically outperformed the broader market and their former parents in the years following separation. The mechanism is straightforward once you see it: forced, valuation-insensitive selling pushes the price below what a patient buyer would pay, and that gap tends to close as the new company builds its own trading history, gets properly covered by analysts, and attracts investors who actually want the business for what it is rather than what it happened to be bundled with.
Newly independent management also often has sharper incentives, no longer subsidizing or being subsidized by a sibling division, no longer buried in a conglomerate’s reporting, with compensation now tied directly to the standalone entity’s performance.
None of this makes every spin-off a buy, with some spun off precisely because the parent wanted to be rid of a genuinely weaker business, and that’s a distinction worth making before backing up the truck. But when the underlying business is good, with a durable moat and real cash generation, and is simply structurally mismatched with its old shareholder base, the best price often appears in the earliest months after separation.
That brings me to today’s analysis. On July 1st, Financial Intelligence powerhouse S&P Global spun off its Mobility business into an independent company – Mobility Global.
Given the track record of spin-offs just laid out and the fact that I always quite liked these operations in the S&P Global portfolio, being a subscription-based business, with a huge moat, an unmatched competitive position, strong financials, and incredible revenue resilience through any economic conditions (this actually was an historically faster growing operation of S&P Global), there is plenty reason to take a close at it.
And at first glance, there is no denying Mobility Global shares look attractive today. The limited analysts covering the stock today forecast high-single-digit revenue growth and low-teens EPS growth through the end of the decade, which is a great prospect for a business this stable and dominant. Yet, the stock is now trading at 14x 2026 earnings, which looks like quite the disconnect and a compelling offer.
Today, I want to fully break down this business – its operations, the products, the model, the moat, the growth prospects, the financials, the outlook, and the current valuation – to determine whether this indeed is a great buying opportunity for long-term investors or whether the current seemingly low valuation is justified.
Should you pick up this recent spin-off or stay away? Let’s break it down!

Welcome to InvestInsights — an independent equity research publication rooted in long-term, buy-and-hold investing, publishing actionable stock/equity research reports weekly!
📈 You’re reading my latest [FREE] stock analysis. If you like this analysis, make sure to like & subscribe to receive much more like this, weekly!
This is Mobility Global!
The Business Explained
Spun off from S&P Global effective July 1, 2026, and now trading on the New York Stock Exchange under the ticker MBGL, Mobility Global is a mobility intelligence company delivering data, analytics, and technology solutions across the full vehicle lifecycle.
I know that still sounds pretty vague, so let’s make that more concrete: A car changes hands many times over its life, going from factory to dealer, owner to owner, trade-in to auction, and insurance claim to salvage. At every step, someone needs to know the truth about that specific vehicle, including whether it has been in an accident, how many owners it has had, whether the odometer is legit, whether it is safe to drive, and what it is actually worth.
Without a trusted, centralized record, buyers get burned by hidden damage or rolled-back mileage, and dealers/lenders/insurers struggle to price and underwrite risk accurately. That is the core problem Mobility Global solves.
In reality, the company sells trusted, verified vehicle and market data to two audiences, primarily in the U.S. First, it sells this information to consumers and dealers buying and selling used cars, providing a verified record of a car’s accident history, ownership, and condition built from 30+ years of data. Second, it sells data to automakers and suppliers to provide predictive analytics to determine what to build, where to sell it, and who to sell it to.
Through these core operations, the company generates $1.75 billion in annual revenue as of 2025, earning it a $6 billion market cap. But don’t mistake it for a small player, as Mobility Global is a dominant force in its niche, with unmatched scale and reach across the automotive ecosystem. The company has a 40k-dealer network, 23+ million monthly unique visitors to its website and app, actively tracks 832 million VINs, and covers 99% of global vehicle production across 145 markets. Furthermore, 100% of the top 40 OEMs are Mobility Global customers, as are 94% of the top 100 suppliers, and 17 of the top 20 financial institutions.
Breaking down the business further, Mobility Global operates through two core segments.
The largest is CARFAX (65% of revenue), the household-name product. CARFAX serves consumers, dealers, service shops, and finance & insurance firms with vehicle history reports, valuations, listings, and service reminders, through products like Advantage, Car Listings, CARFAX For Life, and BIG.
For consumers, it supplies a full vehicle history report, “CARFAX for Life” ownership tracking, and service reminders, so basically everything to give a consumer confidence before they buy. For dealers, finance, and insurers, the same data is used to price trade-ins, disclose history compliantly, and list inventory (Car Listings) with verified history baked in.
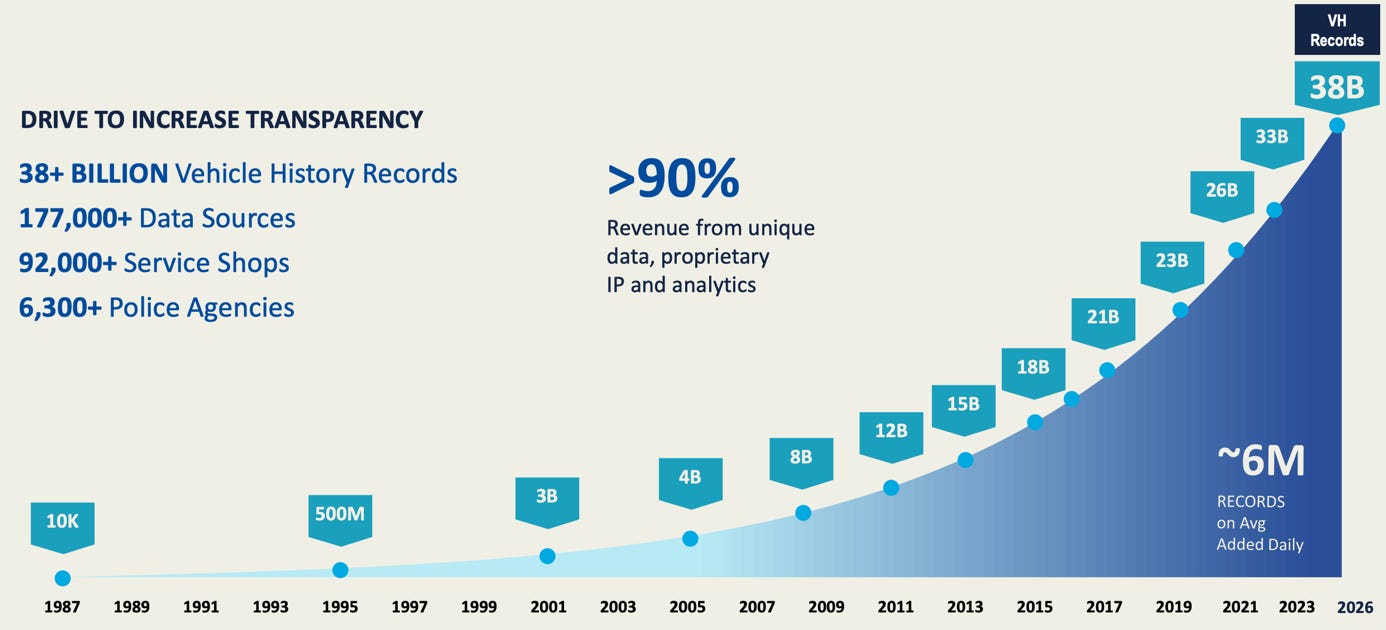
The core underlying asset here is an unmatched data estate. CARFAX is built on 38+ billion vehicle records pulled from 177,000+ sources, including 92,000 dealers/service shops, 6,300 police agencies, and 36 OEM certified pre-owned programs. It still adds an average of 6 million records daily, covering every used car’s history, including accidents, service history, ownership changes, title issues, and odometer readings.
When someone buys a used car and checks its “CARFAX report,” they’re pulling accident history, number of owners, title issues (salvage/flood/lemon), service records, and odometer readings, compiled from DMV, insurance, and repair-shop data.
Among the underlying products, Advantage is the largest contributor, bringing in 38% of CARFAX revenue, as dealers pay a subscription to pull CARFAX vehicle history reports. Second up is Car Listings (22% of CARFAX revenue) – dealers pay to list used inventory on CARFAX’s own high-traffic consumer site/app, where every listing comes bundled with a free history report. This is effectively CARFAX’s own marketplace/lead-gen engine.
CARFAX For Life and BIG (Banking & Insurance Group) bring in 26% of CARFAX revenue. Dealers pay for a retention tool that nudges their past customers back in for service via VIN-specific maintenance alerts. BIG is a separate data product sold directly to lenders and insurers, for underwriting and claims workflows.
The remaining 15% comes from international products.
Together, these products make CARFAX a B2B2C loop and a genuine two-sided marketplace. Consumers trust the CARFAX brand → they shop on the CARFAX site → that traffic is valuable to dealers → dealers buy in and feed more data back (trade-ins, service records) → the dataset gets richer → consumer trust deepens. Each side’s participation makes the product better for the other side, which is the textbook definition of a two-sided network effect.
That dynamic means the business gets stronger the longer it runs, without management having to do much beyond keeping the lights on. CARFAX has an unmatched dealer network of 40k, 53 million Car Care customers, and 96% total in-market awareness – it is the most visited automotive website in the U.S., and the two-sided network means it’s nearly impossible to dislodge.
The second operating segment is B2B – 35% of revenue. This segment provides decision-making tools for the industry itself: data, forecasting, workflow tools, insights, and technology that connect OEMs, dealer groups, suppliers, and other automotive stakeholders.
Operations here can be broken down into two parts. The first is planning and strategy through the Polk Automotive Solutions and Market Scan brands, which give OEMs and suppliers registration data, market forecasts, and competitive intelligence to plan production, inventory, and pricing. One of the most popular products is vehicle and supply chain forecasting, with Mobility Global providing multi-year forecasts of vehicle sales/production down to the component and technology level that automakers can use to plan billion-dollar plant and sourcing decisions. It also includes FAST, a scenario-simulation tool that models shocks (tariffs, price changes, feature changes) and compares outcomes against Mobility Global’s forecasts.
The second, larger piece by revenue is marketing and sales, which answers who is buying, which model, from whom, and at what price to support dealers. This covers the following products, among others:
AutomotiveMastermind is a predictive platform that scores which specific consumers are actually in-market to buy, so dealers and OEMs can target outreach instead of shotgun marketing.
Polk Auto Marketing Solutions is the industry’s benchmark for market share, loyalty, and defection data. It is essentially the scoreboard OEMs use to see how they’re doing against competitors.
Market Scan is a real-time pricing/payment engine embedded directly in dealer software and online marketplaces, used by nearly 11k dealerships.
Most importantly, across B2B, Mobility Global’s reach is incredible and industry-leading, making it the near-default. The company sits on a database with 12 billion transaction records, 832 million VINs tracked, 99% of global vehicle production covered across 145 markets and 400 sales brands.
I think that pretty much lays out Mobility Global’s operations and products.
In reality, every product rests on one hugely important asset: a massive, ongoing dataset tied to individual vehicles and the broader market. In fact, 90% of group revenue comes from this database, sourced from 177k unique sources, 92k service shops, and 6k police agencies. CARFAX monetizes that data at the individual car level (trust for one transaction), while the B2B tools monetize it at the market level (planning and targeting across millions of vehicles). It’s the same underlying data engine, sold twice.
That is the business model.
Next up, how does it generate revenue?
CARFAX revenue is primarily subscription-based (81%). Simply, dealers pay recurring fees to pull vehicle history reports (Advantage), list inventory with built-in reports to attract buyers (Car Listings), and send service reminders to past customers (For Life). Consumers also pay directly for one-off reports (~$45 each) when buying a used car themselves. A smaller piece comes from selling data to lenders and insurers (BIG).
In B2B, revenue is also mostly subscription-based (82%), but sold to automakers and suppliers instead of dealers and consumers. OEMs pay for sales-and-marketing tools that help them target the right buyers (automotiveMastermind), and pay for market forecasts and planning data that guide multi-year production decisions (Polk, Strategy & Planning).
So, across both segments, Mobility Global’s revenue is primarily recurring and subscription-heavy rather than one-off sales, which is excellent for reliability and visibility.
Meanwhile, revenue is also very well diversified, with no dependence on any single dealer, OEM, or supplier. It generates roughly 20% of revenue from a wide range of OEMs and suppliers; 18% comes from financial institutions and consumers; and 62% comes from 40,000+ individual dealers. Furthermore, the company is primarily U.S.-centered, generating 83% of revenue from the U.S. and only 17% from international markets.
Crucially, revenue is also primarily non-cyclical, driven by deep embeddedness in customer workflows and the subscription model.
CARFAX specifically even benefits from a weaker economy. When consumers cut back on spending, used car purchases tend to perform strongly, driving growth in CARFAX’s core products. At the same time, B2B is much more cyclical, as the segment sells to OEMs and suppliers whose spending is tied to new-vehicle production, marketing budgets, and expansion plans, all of which see pressure in a downturn.
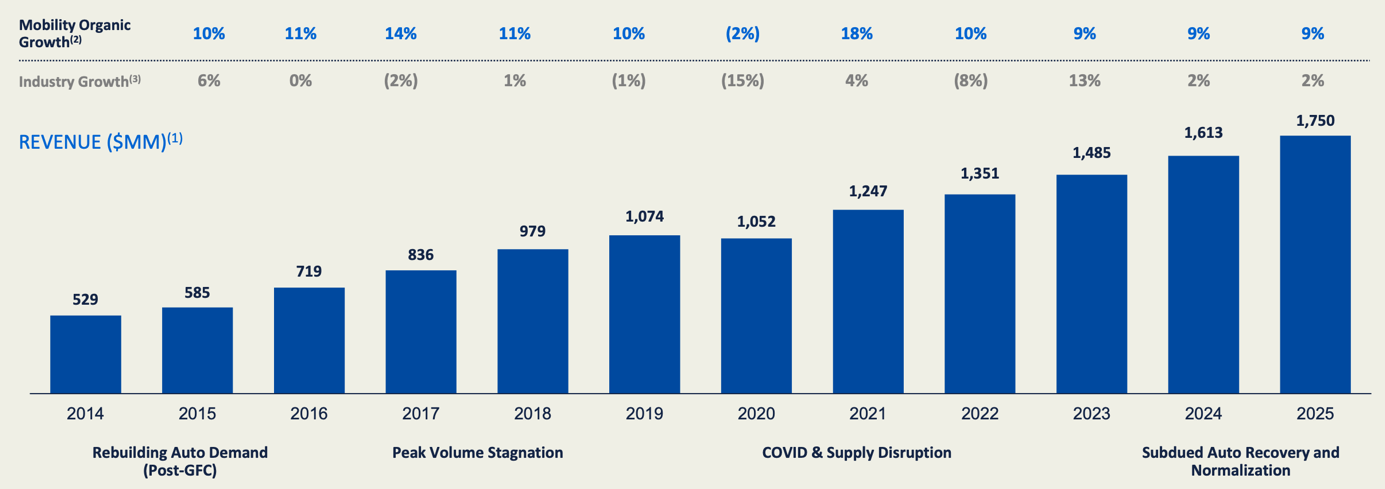
So, it isn’t totally anti-cyclical, but the business as a whole tends to hold up relatively well. When new-car demand weakens (bad for B2B), used-car demand and vehicle age typically rise (good for CARFAX), and vice versa. The data below reflects this: over the last decade, no matter the underlying conditions (outside the 2020 COVID shock), Mobility Global delivered high-single-digit to low-double-digit growth, consistently outpacing the market.
That reflects a very strong business model, a product deeply embedded in customer workflows, and a clear edge over the competition.
I think that covers the core business pretty well. Next up, let’s break down the moat and its growth prospects!
The Moat
Layered on top of a compelling business model, Mobility Global has a pretty formidable, multi-layered moat.
Starting with CARFAX, it has time on its side when it comes to its database. CARFAX has 30+ years of ownership data and a dataset lineage going back over a century (through Polk). A well-funded competitor could theoretically buy access to current dealer and insurance feeds tomorrow, but they cannot backfill three decades of historical ownership and accident records. Vehicle history is only valuable if it’s complete over the car’s entire life; a report that only covers the last 2 years is nearly worthless for catching a rolled-back odometer or a decade-old flood title. That moat widens almost automatically every year, regardless of what competitors spend.
Second, the data network Mobility Global has built over decades is very hard to replicate, and it determines how complete the database is. Relationships with 6,300+ police agencies and 36 OEM CPO programs aren’t easily replicable, and there are 177,000+ total sources; these are institutional relationships built over decades, and there’s limited incentive for a police department or an OEM to hand the same feed to a second aggregator. Simply put, a rival can’t just “buy” equivalent access.
Third, the CARFAX brand has decades of accumulated trust. 96% in-market awareness and “Car Fox” mascot recognition (85%) mean CARFAX is close to a category name, and that lowers the consumer’s cost of trusting the report, which is what makes dealers willing to pay for the badge specifically, rather than a generic or cheaper alternative.
Fourth, switching costs on the dealer side shouldn’t be overlooked. Once a dealer runs Advantage for acquisition pricing, Car Listings for lead gen, and For Life for service retention, CARFAX is embedded in three separate workflows at once, and that’s hard and expensive to rip out.
Overall, that creates a formidable competitive position for CARFAX, for which I see genuinely little risk of disruption. It now holds an estimated 70-80% market share in the U.S. vehicle history report market, a position that still sees little threat despite growing competition. In other words, CARFAX is dominating a niche.
Experian’s AutoCheck is the only real competitor, but nowhere near CARFAX in size and brand trust. It leans on Experian’s own credit-bureau data and has a strength in auction history, which is genuinely useful for dealers buying at auction, but it’s weaker than CARFAX on dealer service records and maintenance history, where CARFAX has a huge edge.
For B2B, the moat works a bit differently — less a two-sided network and more workflow embeddedness plus data scale. OEMs and suppliers build multi-year planning processes around Mobility Global’s forecasts (FAST, Vehicle & Supply Chain Forecasting), so switching means re-architecting internal planning cycles, not just finding a cheaper data feed. So, it’s sticky, but for different reasons, closer to enterprise-software lock-in than a genuine network effect.
Once again, data depth is a real edge here as well. It covers 990 production plants, 2,900+ supplier locations, and 85,000+ vehicle variants. It's also used as a benchmark by 100% of the top 40 global carmakers, 98% of top 40 suppliers, and 100% of top 10 investment banks. And when everyone benchmarks off the same forecasts, a rival isn’t just competing on data quality, but is forced to dislodge a global standard.
So, really, for B2B, the moat is more a combination of embeddedness, being the de facto industry standard, and data breadth.
In conclusion, across the business (CARFAX and B2B), the moat looks quite formidable. I genuinely don’t see any reason to doubt the durability of this business or reason for disruption or competitive concerns, which is brilliant.
Growth Prospects
Next up, what can we expect from Mobility Global in terms of growth? Well, as pointed out earlier, the company has historically been able to grow at a high-single-digit to low-double-digit rate, and considering the underlying industry growth forecast, secular drivers in place, and company-specific growth levers, I don’t expect this to change going forward – this is a business that can continue to compound at a respectable rate.
At the basis sits a growing demand for data and intelligence – that is no different in automotive than in any other industry, and Mobility Global is the primary provider.
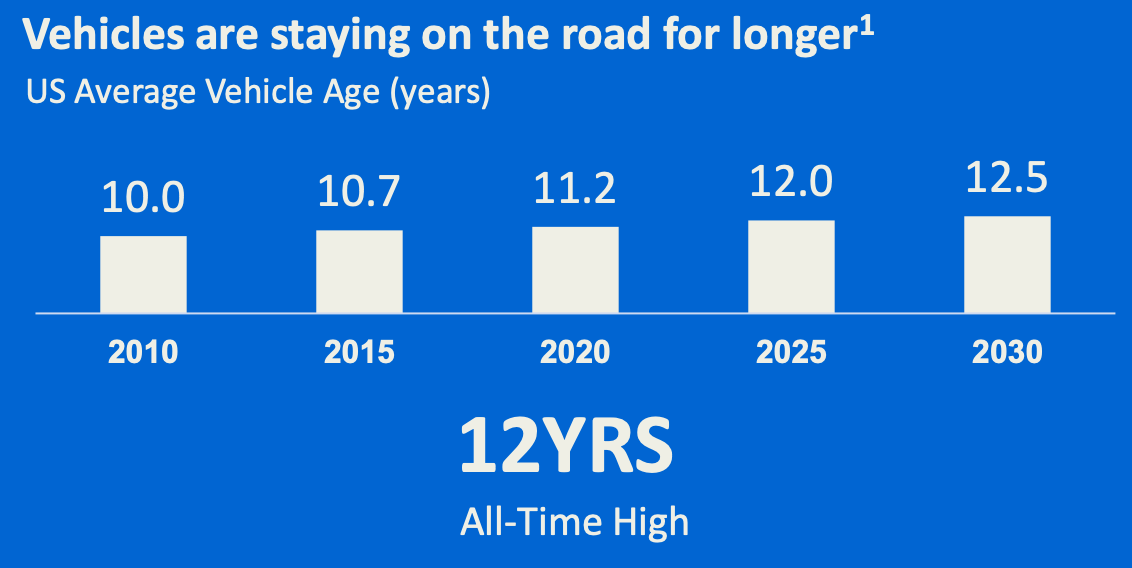
For CARFAX specifically, the aging, longer-lived vehicle fleet is a big demand tailwind. You see, the average U.S. vehicle on the road is now 12.5 years old, and cars are being driven more miles than historically expected even at that age. And that creates a structural tailwind for CARFAX, as older cars generate more service events (feeding data back in), get resold more times (more history checks per vehicle over its life), and need more maintenance-reminder engagement.
Ultimately, that drives more reports pulled, more service records, more dealer subscriptions, more lending decisions, and more car care relationships, increasing the value of the CARFAX platform.
On top of that, we are now hitting the point where used EV’s are entering the resale market at scale for the first time, creating an entirely new tailwind for CARFAX. As early EV leases mature, used EV supply is rising, and battery health/transparency is becoming the key differentiator in used EV retail, kind of a brand-new category of “history” data that plays directly into CARFAX’s business of aggregating vehicle-specific trust data. It’s a new product surface that didn’t exist five years ago.
Thanks to these secular drivers and new opportunities, market forecasts point to a 9.3% CAGR for CARFAX’s closest underlying market, which is excellent, especially considering CARFAX’s history of outperformance. That already suggests at least high-single-digit growth for Mobility Global’s largest revenue source.
Meanwhile, the outlook for the B2B side of the business also looks good, with exploding vehicle complexity, tariff and supply chain volatility, and compressing cycles all driving demand.
The growth in electrification and software-defined vehicles specifically is an important tailwind, reshaping what OEMs need forecasted (like battery chemistry, semiconductor content, charging infrastructure buildout, and software architecture decisions), growing the value of B2B’s best-in-class forecasting products
On top of that, we have an explosion in Chinese OEMs and tariff-driven supply chain uncertainty to factor in. Chinese manufacturers exporting EVs at 30-40% below Western pricing, met with defensive tariffs up to 100% in some markets, are forcing every Western OEM and supplier to re-model sourcing, pricing, and market-entry strategy constantly, which is exactly the kind of volatility that drives demand for scenario-planning tools like FAST and PIQ. And I expect these trends are here to stay.
As a result, market forecasts for the underlying B2B market point to a 9.8% CAGR. These aren’t huge markets, but they are steadily growing thanks to secular trends driving the importance of best-in-class data and forecasting.
So, from a market perspective, the outlook for Mobility Global looks very solid, pointing to at least high single-digit growth.
And Mobility Global itself still sees plenty of opportunities to drive outperformance. While it is the industry leader, it has still captured only a modest share of its TAM.
Mobility Global pins its CARFAX TAM at $60 billion, with an $8 billion core (SAM), of which it still captures just 15%.
Mobility Global pins its B2B TAM at $18 billion, with a $6 billion core (SAM), of which it captures just 10%.
That leaves a good runway!
As for the levers management can still pull, international expansion is the largest and most obvious, though it’s not new. CARFAX entered Europe in 2007 and operates as CARFAX Europe GmbH out of Munich, with local entities in Sweden, Spain, and the Netherlands, alongside the just-launched Germany and the newer Italy push. Yet, the international business has remained small, at just 15% of revenue.
Nonetheless, the opportunity to take a proven, high-margin product into new markets remains. The company plans to roll out solutions like Car Care and Listings in Canada and enter more European countries over the next several years, an incremental opportunity.
On top of this, launching new products using the same data asset always remains an opportunity to boost growth. Products like CARFAX Homegrown, Showroom, Sell My Car, and Premium Listings were all launched using the same database in new packaging, driving incremental revenue. I expect more product releases in the coming years.
Relatedly, Agentic AI integration is a potential value driver worth highlighting. The company is already integrating Agentic AI into FAST, enabling rapid scenario modeling and allowing users to stress-test assumptions and instantly see impacts on production, sales, and market outlooks. This is driving 80% time savings, and it sees a 4x improvement in planning and forecasting quality using Agentic AI, potentially saving customers $100k+ a year per planner, as a 90% automation rate is possible.
In other words, Agentic AI integration could drive significant value for Mobility Global customers and create incremental revenue opportunities.
Weighing everything discussed, I believe Mobility Global can grow its top line by high single- to low double-digit percentages over the next decade.
That largely aligns with management’s 7.5-10% organic annual revenue growth target post-separation, from 2027 onward. That is broken down like this:
Core growth (volume + value) 5-7+% organic growth
New solutions to add 1-2%.
International expansion to add 1-2%:
That seems like a reliable framework, especially given the underlying growth drivers and trends discussed. In my view, from 2027 onward, growth will consistently be at the high-end of this target range, potentially exceeding it under favorable conditions.
For a business that is largely subscription-based, selling a mission-critical product from a dominant competitive position with a strong moat, and a proven track record of counter-cyclical behavior – a performer across cycles – I really like this outlook.
This is an extremely compelling thesis, in my opinion.
That said, let’s delve into the financials and recent performance.
Financial & Performance Review
On August 7, Mobility Global released its second-quarter results, its first as a standalone business, and, not entirely surprisingly, the company reported somewhat messy results that missed expectations, resulting in a lowered full-year outlook.
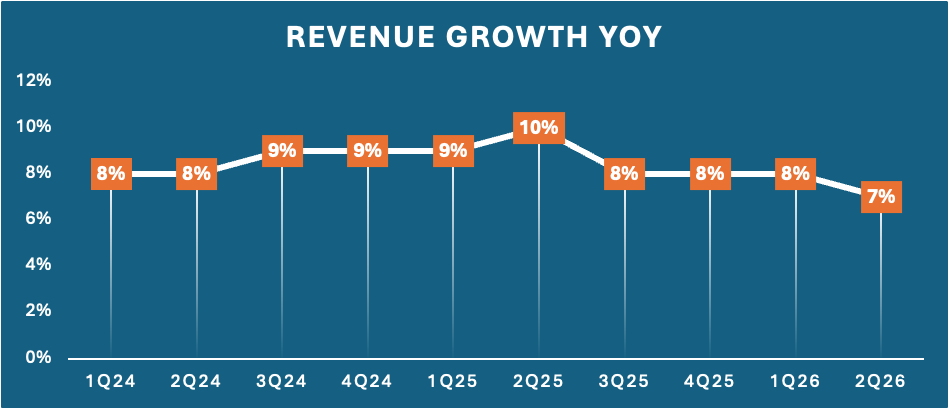
Starting at the top, Mobility Global reported Q2 revenue of $468 million, missing the consensus by about $2 million and coming in modestly below management’s own expectations. Nonetheless, this still reflects fully organic YoY growth of 7% YoY, which is a minor deceleration from 8% in the prior three quarters and the slowest growth rate in 2.5 years, but in general largely in line with organic growth in recent years – this isn’t a dramatic slowdown in any way, only a minor miss.
Zooming out, Mobility Global has delivered very healthy growth in recent years, with an 8.6% organic CAGR over the last three years, driven by a 4.5% CAGR for B2B and an 11% CAGR for CARFAX. I used this graph from the investor day presentation before, but Mobility Global has been delivering excellent organic growth over the last decade, consistently outperforming the underlying industry. Outside of 2020, a standout year due to COVID, the company has delivered at least 9% organic revenue growth every year since 2015, which is excellent.
Given the spin-off and subsequent operational changes and costs, we will likely see some mixed results over the next few quarters, as we saw in Q2, with some one-off impacts and the company changing its sales motion, but I expect results to stabilize in 2027 and return to the norm in the high-single to low-double digits.
Shifting back to the Q2 results and breaking this down further, CARFAX was the outperformer, delivering 8% revenue growth, in line with Q1. Subscription revenue was up 8% YoY and transaction revenue up 9% YoY, driven by almost all major product lines in the U.S. and abroad.
Crucially, the company shifted its go-to-market approach a few quarters ago, practically focusing on selling all three core CARFAX products (Advantage, Listings, and Service Loyalty) in one package instead of separately, but this has not yet delivered the expected results. Primarily, the new strategy lengthened the sales cycle, and while initial adoption was as expected, sales cycles lengthened further in Q2, creating a comparative YoY drag.
Management now plans slight changes and expects improvements in the sales motion in H2. It will recalibrate its sales approach, shifting back to selling the products individually, shortening the sales cycle, while still allowing dealers to pick up the package deal at their own pace. That should still motivate dealers to adopt all three products, increasing lifetime value for Mobility Global, while relieving pressure on the sales cycle.
Meanwhile, B2B revenue in Q2 was up 4% YoY, down from 8% growth in Q1, with 6% subscription revenue growth offset by a 4% decline in transactional revenue YoY. This reflects some recall revenue that is pushed to H2 due to the pending final court order and modest delays in planning solutions projects due to the uncertain macro environment and challenging comps.
Importantly, while the Q2 results reflect these macro and strategic headwinds, management does not view them as a change in the underlying business and expects to build momentum into 2027, indicating accelerating growth.
On one final note, international expansion is progressing well. CARFAX Germany launched in early July, and Mobility Global reported healthy double-digit revenue growth in Europe in Q2, despite weaker-than-expected transactional revenue reflecting a weak macro.
On that, let’s move to the bottom-line financials.
Starting with Q2, Mobility Global delivered an adjusted EBITDA of $202 million, up 7% YoY and reflecting a 43.2% EBITDA margin, up 80 bps YoY. This brings H1 EBITDA to $386 million, or a 42% EBITDA margin, up roughly 20 bps YoY.
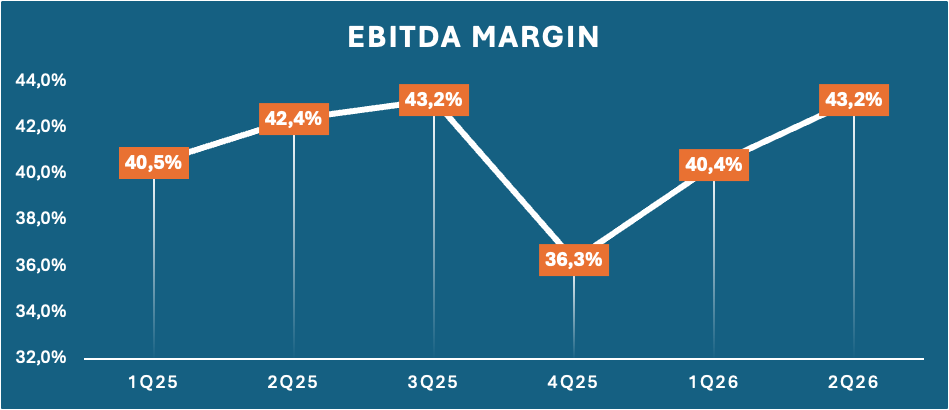
Those are excellent numbers, reflecting a capital-light, subscription-based business model, and these margins are gradually expanding thanks to the nature of the business – the core costs are largely fixed, so as the company sells more products, reports, or subscriptions based on the same underlying database, a large share of every incremental dollar falls straight to the bottom line rather than being consumed by the cost of producing it, as proven by just 2% YoY growth in operating-related expenses in Q2, showing strong operating leverage.
Also worth pointing out, the sales and marketing cost of a dealer relationship is largely paid once, then amortized over years of renewals, creating a very capital-light business.
Overall, that is a great business model positioned to compound earnings.
Near-term margin expansion will likely be more limited due to a period of investment to create a standalone public company, but in the coming years management expects to deliver margin expansion like clockwork. Beyond the business model and operating leverage, it sees growth in higher-value products, revenue and cost synergies under the new structure, and AI-driven efficiencies translating to margin expansion.
Moving further down the P&L, Mobility Global reported a GAAP net income of $53 million, down 18% YoY, but this includes a significant amount of one-time costs related to separation from SPGI, so this number isn’t really representative. Ultimately, this translated to an EPS of $0.18, missing the consensus by $0.06.
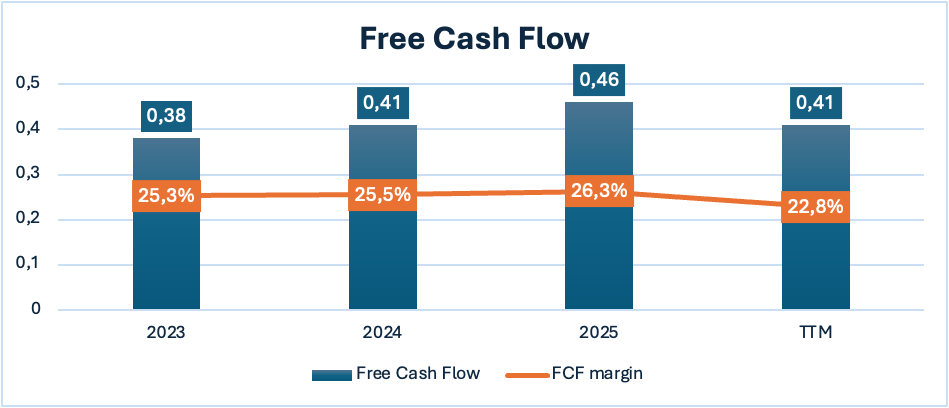
Finally, when it comes to cash flows, the capital-light model shines. Mobility Global’s CapEx intensity is incredibly low at just 1-1.5% of revenue, allowing for excellent FCF margins. Based on the historical data provided, the company generates a mid-twenties FCF margin and is expanding it.
At the same time, the company faces near-term headwinds related to the spin-off, including $75-100 million in transition costs over the next 12-18 months, putting pressure on the margin in 2026 and likely 2027, but given the expectation for gradual margin expansion, I believe a FCF margin approaching 30% is possible by 2030.
That brings me to the balance sheet, which is starting off slightly leveraged. Mobility Global issued $2 billion in senior unsecured notes, largely to fund a $1.9 billion one-time payment to S&P Global to finalize the spin-off. As a result, the company now sits on $186 million in cash on hand and just over $2 billion in total debt, translating to a net leverage ratio of 2.4x TTM adj. EBITDA, which isn’t all too bad. Given the cash flows Mobility Global generates quite reliably, this seems like a very manageable position – I expect the balance sheet to strengthen in the coming years.
Meanwhile, management is also committed to returning 75% of FCF to shareholders annually. Now, there will be no M&A or buybacks before early 2027, but the company initiated a dividend of $0.06 per share, translating to a solid opening yield of 1.18% based on a healthy 38% payout ratio, which is based on depressed GAAP earnings due to one-off costs in 2026 – management targets a 20-25% payout ratio.
Ultimately, I really like the setup here, with the business looking financially attractive. This is a business positioned to deliver healthy top-line growth with a very strong track record of growth through the cycles, the cost profile is excellent, operating leverage is nearly automatic thanks to the sublime business model, cash flows are strong, and the initial dividends look attractive.
Sure, I would prefer a stronger balance sheet, near-term top-line growth is likely mixed, and the P&L will absorb some one-off costs in the coming quarters that will impact cash flows, but the long-term setup is excellent, with a business model and financial profile built for long-term compounding and spitting off cash.
There is no denying the setup is attractive.
Thesis Risks – AI and OEM Disintermediation
Before we jump to the outlook and ultimately valuation, I first want to break down two bear arguments worth considering.
First, OEMs could disintermediate CARFAX by building their own service and ownership records and, theoretically, competing history products that cut CARFAX out at the source. This one is often highlighted.
As vehicles get more connected, automakers increasingly have direct telematics access to their own vehicles’ diagnostics, service events, usage data, accident-related sensor triggers, dealer service visits logged in-system, and mileage read directly off the vehicle rather than reported by a shop. In theory, an OEM with a large enough connected fleet could build its own “vehicle history” product straight from first-party data and bypass CARFAX’s aggregation layer entirely for their own brand’s vehicles.
Positively, a used-car buyer needs cross-brand, whole-life history. An OEM’s telematics data only covers its own vehicles, and only from the point of connectivity onward. This is structurally a multi-brand aggregation problem, not a single-brand data-capture problem, and no individual OEM is incentivized to solve it for competitors’ cars too. That leaves CARFAX with a strong edge.
Additionally, independent third-party verification is also part of the value of a CARFAX report – CARFAX has no incentive to mess with the data, while an OEM does benefit from its cars being sold.
Ultimately, I don’t think CARFAX has much to fear here.
Second, there is the AI threat, which comes down to zero-click disintermediation of the consumer touchpoint. You see, CARFAX’s B2B2C model depends on ~23 million monthly visitors landing on the CARFAX site/app, which makes Car Listings valuable to dealers and builds the Car Care audience. But if AI shopping agents start answering directly instead of sending the person to carfax.com, that’s the same “zero-click” traffic erosion that’s already hit Yelp, TripAdvisor, and publisher-dependent businesses. This means the report itself might still get pulled via API, but if the consumer relationship moves to an AI intermediary instead of the CARFAX brand and site, that erodes brand trust and network-effect dynamics, as well as several revenue sources, like Listings and DTC report sales.
For the core Advantage product, exposure is lower, since it’s a point-of-sale trust signal: the CARFAX badge reassures a human buyer standing in front of a car. Similarly, CARFAX for Life or BIG are structurally different and much better insulated. For Life is a push-based, owned relationship, and BIG is embedded directly in lender/insurer workflows, so neither depends on someone landing on carfax.com first. Finally, B2B is entirely insulated as well, as these are direct enterprise relationships and embedded workflows.
So, it is worth considering, but ultimately it only applies to a limited part of the business – the piece depending on traffic.
Yet, that might still overestimate the risk. You see, AI is extremely good at processing and generating from existing data, and essentially useless at manufacturing history that was never captured. No LLM can generate a real 2015 accident record for a specific VIN, which is not public data.
That means AI can’t answer the questions for which consumers and dealers pay CARFAX without access to CARFAX’s data – AI models are only as good as the data they’re trained on. Of course, CARFAX could sell its data to AI Agents and charge per query, but that would still give up the pricing power and brand relationship that come with being the direct-to-consumer destination, while AI fundamentally isn’t really a threat given its scarce, proprietary data.
So, really, I think AI increases the value of Mobility Global’s own proprietary models and data. In this case, I don’t think even the distribution layer is at risk. Unlike Yelp and TripAdvisor, CARFAX’s data isn’t open and crawlable. You see, reviews sit on public web pages, allowing Google to index them, and eventually AI Overviews and chatbots could summarize that content directly because it was already freely accessible to any crawler.
For CARFAX, the moat is owning information nobody else has, sitting behind a paywall. An AI agent can’t scrape or summarize what it can’t see. For an agent to give a consumer “this car’s real history,” it has no path around either (a) paying per-query through some kind of licensing/API arrangement, or (b) not being able to answer the question with CARFAX-grade completeness at all.
Long story short, I don’t see any fundamental threats to Mobility Global’s business that warrant close monitoring right now.
More content like this? Consider InvestInsights Premium
InvestInsights Premium is designed to help you find best-in-class compounders, identify deep-value opportunities, avoid costly mistakes, and stay focused on fundamentals when markets get noisy, with full transparency into how I make decisions over time.
In practice, this gets you:
6–8 Research Reports per month, 2x more than free subs do, which includes 3-4 Deep Dives!
Full visibility into my personal portfolio, including allocations, transactions, and conviction levels.
An overview of target prices and ratings, updated weekly, all available in a web-based Hub (including all my portfolio data).
Price tag? Only $95 per year or $9.50 a month. That comes to just $1 per analysis, with the rest provided at no cost.
Sound useful? You can upgrade to Premium today using the button below!
Outlook & Valuation
As always, let’s start with management’s own guidance, which was lowered following a tougher-than-expected Q2. Management now guides for FY26 revenue growth of 6.9-7.7%, aiming for accelerating growth toward the end of the year, partly thanks to a revised go-to-market approach and new B2B product launches. This should result in FY26 revenue of between $1.870 billion and $1.885 billion.
Furthermore, management expects lower EBITDA margins in H2, driven by margins typically being lower in the second half due to the timing of renewal cycles and advertising and investment spend, and the company realizing some incremental corporate expenses due to the change to a stand-alone public company, with the latter creating a 150 bps headwind.
As a result, it expects to deliver a full-year EBITDA of between $745 million and $760 million, implying an EBITDA margin of roughly 40% at the midpoint.
Additionally, it expects to incur approximately $100 million in one-time cash costs associated with completing the spin-off and stand-up of Mobility Global, of which half will be incurred in 2026, it will incur incremental interest expense from $2 billion in bonds (estimated at $55 million), and cash taxes will be higher for the next 12 years due to the disallowance of a portion of amortization of intangible assets related to the IHS Markit acquisition. This will put pressure on 2026 FCF.
Looking ahead to 2027, management expects this to be a real inflection point, with improved momentum, given 2026 is a real transition year.
With that guidance, let’s move to my own financial forecast. For 2026, I now expect revenue to come in at the high-end of guidance. After the mild outlook cut following the Q2 results, I believe management has taken a cautious approach, given healthy underlying dynamics and broad expectations for better growth in H2, especially with the changed sales motion. On the bottom line, I now expect an EPS of $1.50, assuming margin pressure in line with management’s guidance.
Looking further ahead, I expect growth to normalize in 2027-2029 toward the high end of management’s guidance, say 9-10%, which seems fair, as broken down earlier. On the bottom line, I expect some margin pressure to persist in 2027 due to further separation costs and financial headwinds related to the separation from S&P Global. Nonetheless, I see room for margins to expand slightly from 2026 levels as headwinds ease and faster top-line growth allows for stronger operating leverage. Beyond 2027, I anticipate stronger margin expansion as separation headwinds to the P&L and cash flow statement are mostly in the past, allowing Mobility Global to deliver far stronger results. For EPS, that should allow for mid-teens growth, not yet assuming any buybacks, which I also expect to start in 2028 as part of management’s goal to return 85% of FCF to shareholders.
For perspective, assuming a 40% FCF payout ratio for dividends, I believe Mobility Global should be able to buy back 4-5% of its share count annually if it continues to trade at similar multiples and targets to return 85% of FCF, so that can be a fairly strong tailwind to EPS.
All these assumptions are reflected in the financial model below!
For perspective, management targets 7.5-10% organic revenue growth annually, 50 bps of margin expansion beyond 2028, and 8-11% average EBITDA growth.

That brings me to the valuation, and with shares currently trading below the $21 per share at which the company went public, which already wasn’t overly rich, I can’t deny shares look quite attractively priced. At a current share price of $20.50, these trade at:
13.7x 2026 earnings
14x 2026 FCF (consensus)
A PEG of 1.03x
Obviously, we don’t have a historical median to go off of here, and a good peer comparison is similarly tough given the niche in which Mobility Global operates fairly dominantly. The best peers to compare it to are probably Verisk Analytics and Equifax. Verisk uses the same playbook but for insurance instead of the automotive end market – a company built on a proprietary, decades-deep dataset, subscription-heavy revenue, high switching costs, and deeply embedded in customer workflows. Equifax is also a data-and-analytics business (credit bureau data instead of vehicle data), also subscription-heavy, and historically difficult to dislodge given entrenched lender relationships.
Looking at the multiples these “closest” peers demand, Verisk is currently priced around 25x earnings and tends to command a low-twenties multiple, while Equifax trades at 22x earnings. For reference, Verisk has a similar growth profile to Mobility Global, but stronger margins, while Equifax has lower margins but is growing faster. Furthermore, both consistently demand an FCF multiple in the high teens to low-twenties.
Given the growth and margin profile, and considering that Mobility Global currently carries more leverage and still has to prove itself as an independent company, a discount to these peers seems justified. With that, I would arrive at an earnings multiple of roughly 17-18x and a similar FCF multiple.
And considering the quality of the business, that seems far from rich. I mean, this is a business with over 80% subscription-based revenue, a demonstrated ability to keep growing through economic cycles, and a data moat 30+ years in the making that no well-funded rival can simply buy or replicate overnight. Layer on a healthy outlook of high-single-digit revenue growth and mid-teens EPS growth through 2030 as margins expand and the balance sheet delevers, a two-sided network effect that gets stronger the longer it runs, and about as little near-term disruption risk as a data business can credibly claim in the AI era, and you have got a very high-quality business for which 17-18x earnings still looks straight up cheap.
Say we apply a further discounted 16x exit multiple to my current 2028 EPS estimate, which I believe is plenty conservative to account for the lack of an execution track record; using this, I calculate an end-of-2028 price target of $30.60, which implies an annualized return of roughly 18.5% (including dividends), which comfortably exceeds my 15% threshold despite very conservative assumptions.
In other words, I think this recent spin-off's risk-reward profile looks excellent. This is a high-quality business trading at extremely attractive levels, as the market struggles to value it fairly amid selling pressure that is near-standard for a spin-off.
At current levels of $20.50 (or really anywhere below $21,50), I view Mobility Global as an excellent long-term buy – this is a business with all the compounding ingredients.
Rating + fair value: Buy — Accumulate below $21.50
2028 Target Price: $30.60
Implied CAGR from current price: ~18.5%
Please leave a like if you enjoyed this post and found it valuable!

currently i would prefer s&p itself at these prices.
And now for just $5 billion