


Lululemon Athletica Inc. - Time to buy? What fundamental & technical analysis is telling us
In a collaboration between Rijnberk InvestInsights and My Weekly Stock, we revisit our Lululemon investment thesis following the company's Q1 results, released last week.


This post is a collaboration between
and , combining both fundamental and technical insights into Lululemon shares following the Q1 results. We hope you enjoy this post, and make sure to subscribe to both our publications for much more investing content!

Lululemon is probably the company covered most often on Rijnberk InvestInsights, hammering on it as a great investment opportunity in recent months. For those unfamiliar with the company, check out our deep dive below!

In this post, I will take a close look at the company’s Q1 results, which it reported exactly one week ago, followed by a technical analysis by
.Lululemon beat the Wall Street consensus last week on both top and bottom lines and hiked its FY24 profit guidance to above Wall Street expectations. This led to a positive reaction in the following trading session, with shares gaining 4% but only 1% over the last week.
However, Lululemon shares are still down a whopping 38% YTD, which is far from justified and driven by short-term skepticism. Meanwhile, Lululemon remains as solid as ever, and while growth might be slowing down, the company remains in a prime position for long-term double-digit growth, driven by its distinguished business model, product offering, and strong brand!
Long story short, we continue to see Lululemon shares at current prices of around $318 per share as a compelling investment opportunity from a fundamental perspective. Technical analysis, however, makes us slightly more careful.
Top line growth slows down but investors shouldn’t worry
Lululemon reported its Q1 earnings on Wednesday, June 5. The apparel leader achieved a quarterly revenue of $2.21 billion, which is up 11% YoY and marginally beat the Wall Street consensus. This result was more than decent, as Lululemon is lapping a very impressive 24% growth from last year in a challenging operating environment in which consumers are less willing to spend on discretionary items.
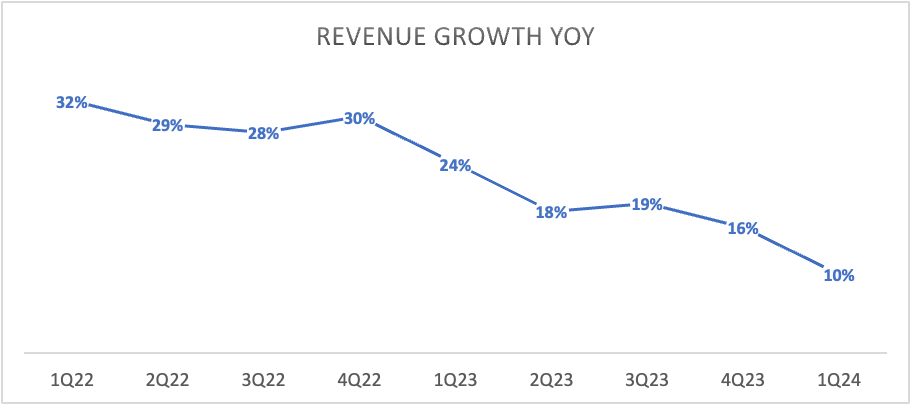
As a result of these operating dynamics, top-line growth has been slowing down significantly over recent quarters, decelerating from 20-30% growth to the low teens this quarter. However, considering the underlying dynamics, we do not view this slowdown as overly worrying. The slowdown is industry-wide, and whereas Lululemon was able to offset cyclical weakness through rapid international and product expansion in prior years, it has now reached the size in which it is no longer able to offset these headwinds.
On top of this, management also admitted to making several misjudgments in Q1, which additionally impacted the business, though still outperforming estimates. Especially in Women’s, which is its largest market, management made several mistakes, misjudging opportunities and consumer demand. This includes a too-limited color palette to satisfy demand or not enough depth in the products that turned out to be popular.
Management is fully focused on resolving this, but most importantly, it should not have any longer-term effects. Still, management did reorganize its product development and merchandising C-suite following the departure of Chief Product Officer Sun Choe. Lululemon will now implement a new leadership structure comprised of leaders from its Merchandising and Brand units.
While investors saw this as a negative surprise, I was quite pleased with the structure as it seems more direct and better streamlined when it comes to product development and go-to-market strategies. While we will have to see how this works out, I think this new structure will benefit Lululemon.
Now, considering these factors, the growth slowdown should be no reason for concern for investors. Lululemon is still gaining share in apparel, outgrowing its larger peers in revenue dollars, and is gaining popularity among younger generations, positioning it favorably to continue benefitting from the long-term growth expected for the athleisure market, which is projected to grow at a CAGR of 9.3% through the end of the decade, according to Grand View Research.
Through Lululemon’s consistent market share gains, favorable positioning towards younger generation and higher-end products, and massive room for growth internationally and through expansion into new markets like men’s and sneakers, it should be comfortably able to outpace the underlying market with growth in the low-to-mid-teens.
Please don’t get distracted by short-term headwinds and share price volatility, but remain focused on the long-term prospects instead. Lululemon still has a very bright future, at least in our view.
Positively as well, we expect growth to stabilize from here and remain in the high-single to low double digits. This should, over time, allow shares to regain some investor confidence, we believe. Management now projects similar growth in Q2 but a slight uptick in the second half of the year, helped by several upcoming product launches.
Lululemon remains one of the most innovative in the apparel industry today, with its high-end fabrics and materials. For example, the company just released its Show Zero technology in Men’s polo shirts, which uses an innovative construction to hide the appearance of sweat, designed for sports like golf. Pretty impressive! Meanwhile, the company is also seeing better-than-expected demand for its newly introduced footwear products, which is a big potential market.
Looking deeper into the Q1 results, we can see top- line growth was driven by 12% growth through its store channel, which now accounts for 59% of revenue. This was helped by square footage growth of 14% YoY thanks to 49 new stores opened since Q1 2023. Meanwhile, digital accounted for 41% of revenue and was up 8% YoY due to some softness in the U.S.
Looking at product segments, women’s continues to grow very steadily at 10%, while men’s grew by 15%, in part thanks to a number of product releases. This is very much in line with expectations as Lululemon continues to grow its men’s offering and is seeing solid adoption and market share gains. Still, even in the US., the men’s brand awareness remains low at just 20%, which leaves Lululemon with a massive opportunity.
By region, international continues to be a significant growth driver, with revenue growing by 37% in Q1, driven mainly by solid traction in China, where revenue grew by 52%. The rest of the world grew by 30%. International continues to be a significant growth opportunity for Lululemon, with very low penetration and brand awareness outside of the Americas. As of FY23, international was still only 21% of revenue, and management can see this easily grow to 50%, driven by effective merchandising and a higher penetration.
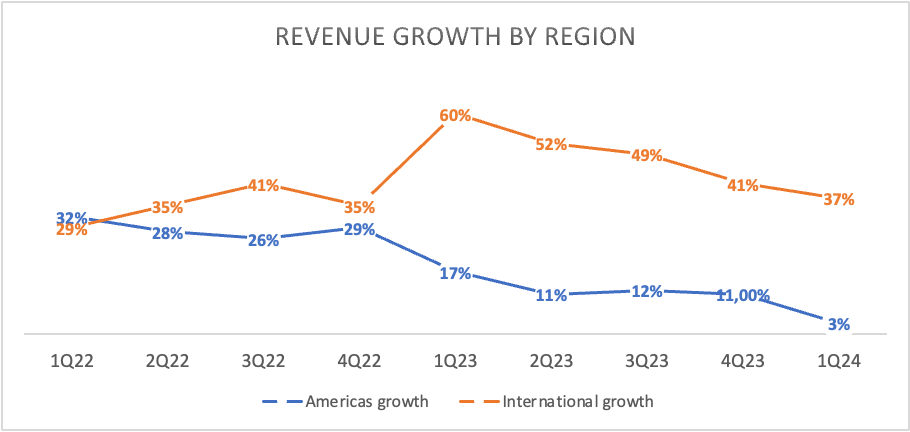
However, solid international growth in Q1 was partially offset by weakness in the Americas as revenue in Canada grew by only 12%, while growth in the U.S. slowed down significantly to just 2% due to the earlier-mentioned headwinds.
Positively, these should be only temporary, and Lululemon’s growth opportunity, even in its largest market, remains significant, with unaided brand awareness still only in the low 30s. Even amid headwinds, Lululemon gained market share in Q1 and there isn’t much to cause doubt about its future!
Again, it should be comfortably able to outpace the underlying market with growth in the low-to-mid-teens.
Profits come in ahead of expectations
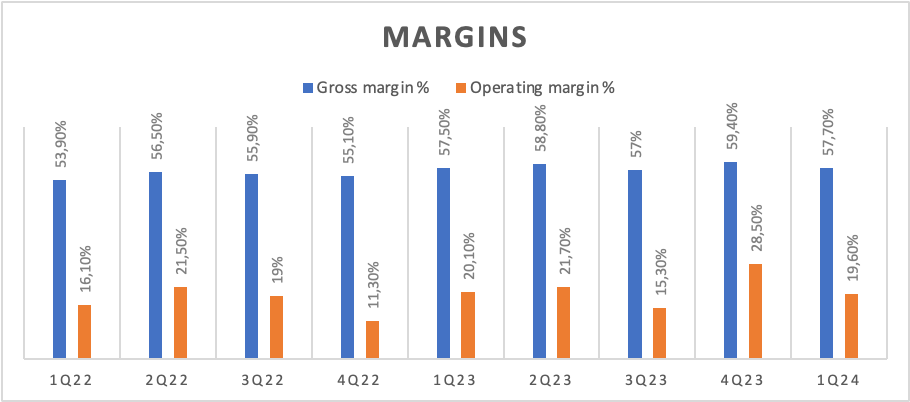
Moving to the bottom line, we can see the company performed really well. The gross margin expanded by 20 bps in Q1 to 57.7%, which remains industry-leading. This resulted in a gross profit of $1.28 billion.
The expansion was driven by a 120 bps increase in the product margin thanks to lower input and freight costs, as well as lower inventory provisions. However, this was offset by a 50 bps headwind from markdowns and a 70 bps of deleverage on fixed costs and foreign exchange. Nothing too significant there.
Meanwhile, SG&A expenses remain high at 38.1% of revenue, which was up 70 bps but better than the expected 130 to 140 bps, thanks to a better top-line performance and solid cost management.
This translated into an operating margin of 19.6%, which was still down slightly from 20.1% last year due to a slowing top line and continued expense growth. This resulted in an EPS of $2.54, beating estimates by $0.12 or 5%. This was up 11% YoY, supported by repurchases.
Since the start of Q1, Lululemon has repurchased approximately $530 million worth of shares, or about 1.2% of outstanding shares, which is great, especially at current share prices. In response to this, the board has also approved an additional $1 billion to add to the authorization, bringing the total capacity remaining to $1.7 billion or about 4% of outstanding shares.
Meanwhile, the solid bottom-line performance also allowed Lululemon to maintain a solid balance sheet with $1.9 billion in cash. Also, inventory at the end of Q1 was down 15% versus last year to $1.3 billion, which should limit further markdowns in coming quarters.
All in all, a very solid quarter!
Outlook & Valuation
Turning to short-term guidance, management now expects to report revenue growth of 9-10% in Q2, with revenue in the range of $2.4 billion to $2.42 billion. This shows a slight growth stabilization. The gross margin is, however, expected to decrease by 100-110 bps, mainly driven by deleverage on fixed costs and the ongoing investment in a multi-year distribution center project.
For the operating margin, this translates into a decrease of 50-60 bps. This results in EPS guidance of $2.92 to $2.97, which at the midpoint sits at YoY growth of 10%.
With the expectation for a slight improvement in growth in the second half of the year driven by exciting product releases and a slightly better operating environment, management has maintained its FY24 guidance for revenue of $10.7 billion to $10.8 billion, representing YoY growth of 10-11%.
The full-year gross margin is expected to be roughly flat from last year, and the operating margin to increase by 10 bps. However, while this isn’t anything too exciting, the repurchases made by management so far this year and a slightly higher net income have allowed management to increase the EPS guidance, now pointing to an EPS in the range of $14.27 to $14.47, up 11-14%, and ahead of my prior estimate.
As a result, we have upgraded our short-term financial projections. At the same time, I have trimmed my medium-term projections a bit to account for some prolonged economic weakness and a tougher operating environment. This results in the following financial projections.
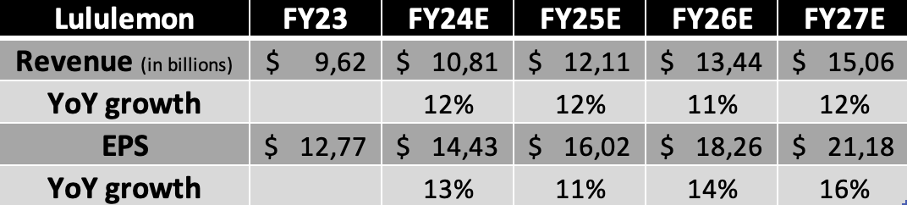
Based on these projections, shares now trade at roughly 22x earnings, which is quite a bit below its 5-year average of 46x. Of course, growth has slowed down significantly, but I still feel like shares are valued quite cheaply today after the sell-off YTD. This translates into a PEG of 1.63, which is roughly in line with the sector median and a 27% discount on its own 5-year average.
For reference, Nike trades at 26x this year’s earnings and a PEG of 2.28, and while this premium might be justified up to a point thanks to Nike’s brand strength, this premium is now way too high.
Long story short, Lululemon is trading at a discount after this year’s sell-off, presenting investors with a great opportunity. Even when we use a conservative 25x multiple, which is more than justified when taking into account its premium brand and growth projections, we calculate a target price of $401 based on 2025 earnings. This reflects the potential for annual returns exceeding 14%, which should comfortably beat global benchmarks and is more than enough to warrant a buy rating today, based on the fundamentals.
In our view, the current risk-reward from a fundamental perspective is extremely favorable for Lululemon shares, and we, at Rijnberk InvestInsights, are active buyers!
That brings us to the technical analysis.
Technical analysis from My Weekly Stock
My Approach
At My Weekly Stock, we blend in-depth market analysis with proven momentum-based trading strategies. I have developed a proprietary momentum approach that I use to analyze stocks, which relies on three key components:
Performance: I like to see stocks trading within 5% of their 1-year high, which indicates strong momentum and minimal resistance. Winning stocks also typically perform better than their peers across multiple timeframes.
Trend: I use the 9 and 21 (or 30) exponential moving averages (EMAs) on the daily and weekly charts to assess the trend’s strength. Strong trends typically involve the 9-week EMA being above the 30-week EMA, the stock trading above both EMAs and rising trend lines. I score each stock’s chart out of 5, with a score above 3 suggesting a solid trend.
Key Levels: Support and resistance levels are critical technical analysis components, serving as indicators for potential market reversals or continuations. My preferred method is to look for previous highs and lows, any levels where the trend has historically changed, and price gaps.
My approach involves identifying stocks with strong positive momentum and riding their upward trend for as long as possible. While timing the market to perfection is not my goal—since catching the exact highs and lows is more a matter of luck than skill—my experience and research have proven that there is significant profit to be made in the meat of a move.
Lululemon Momentum Analysis
Performance
Lululemon is down 10% in the past month, 32% in the last quarter, and 12% over the last year. The stock is trading 38% below its 1-year high, indicating a significant drawdown and suggesting strong overhead resistance. Its performance has been lagging behind its sector, industry, and peers.
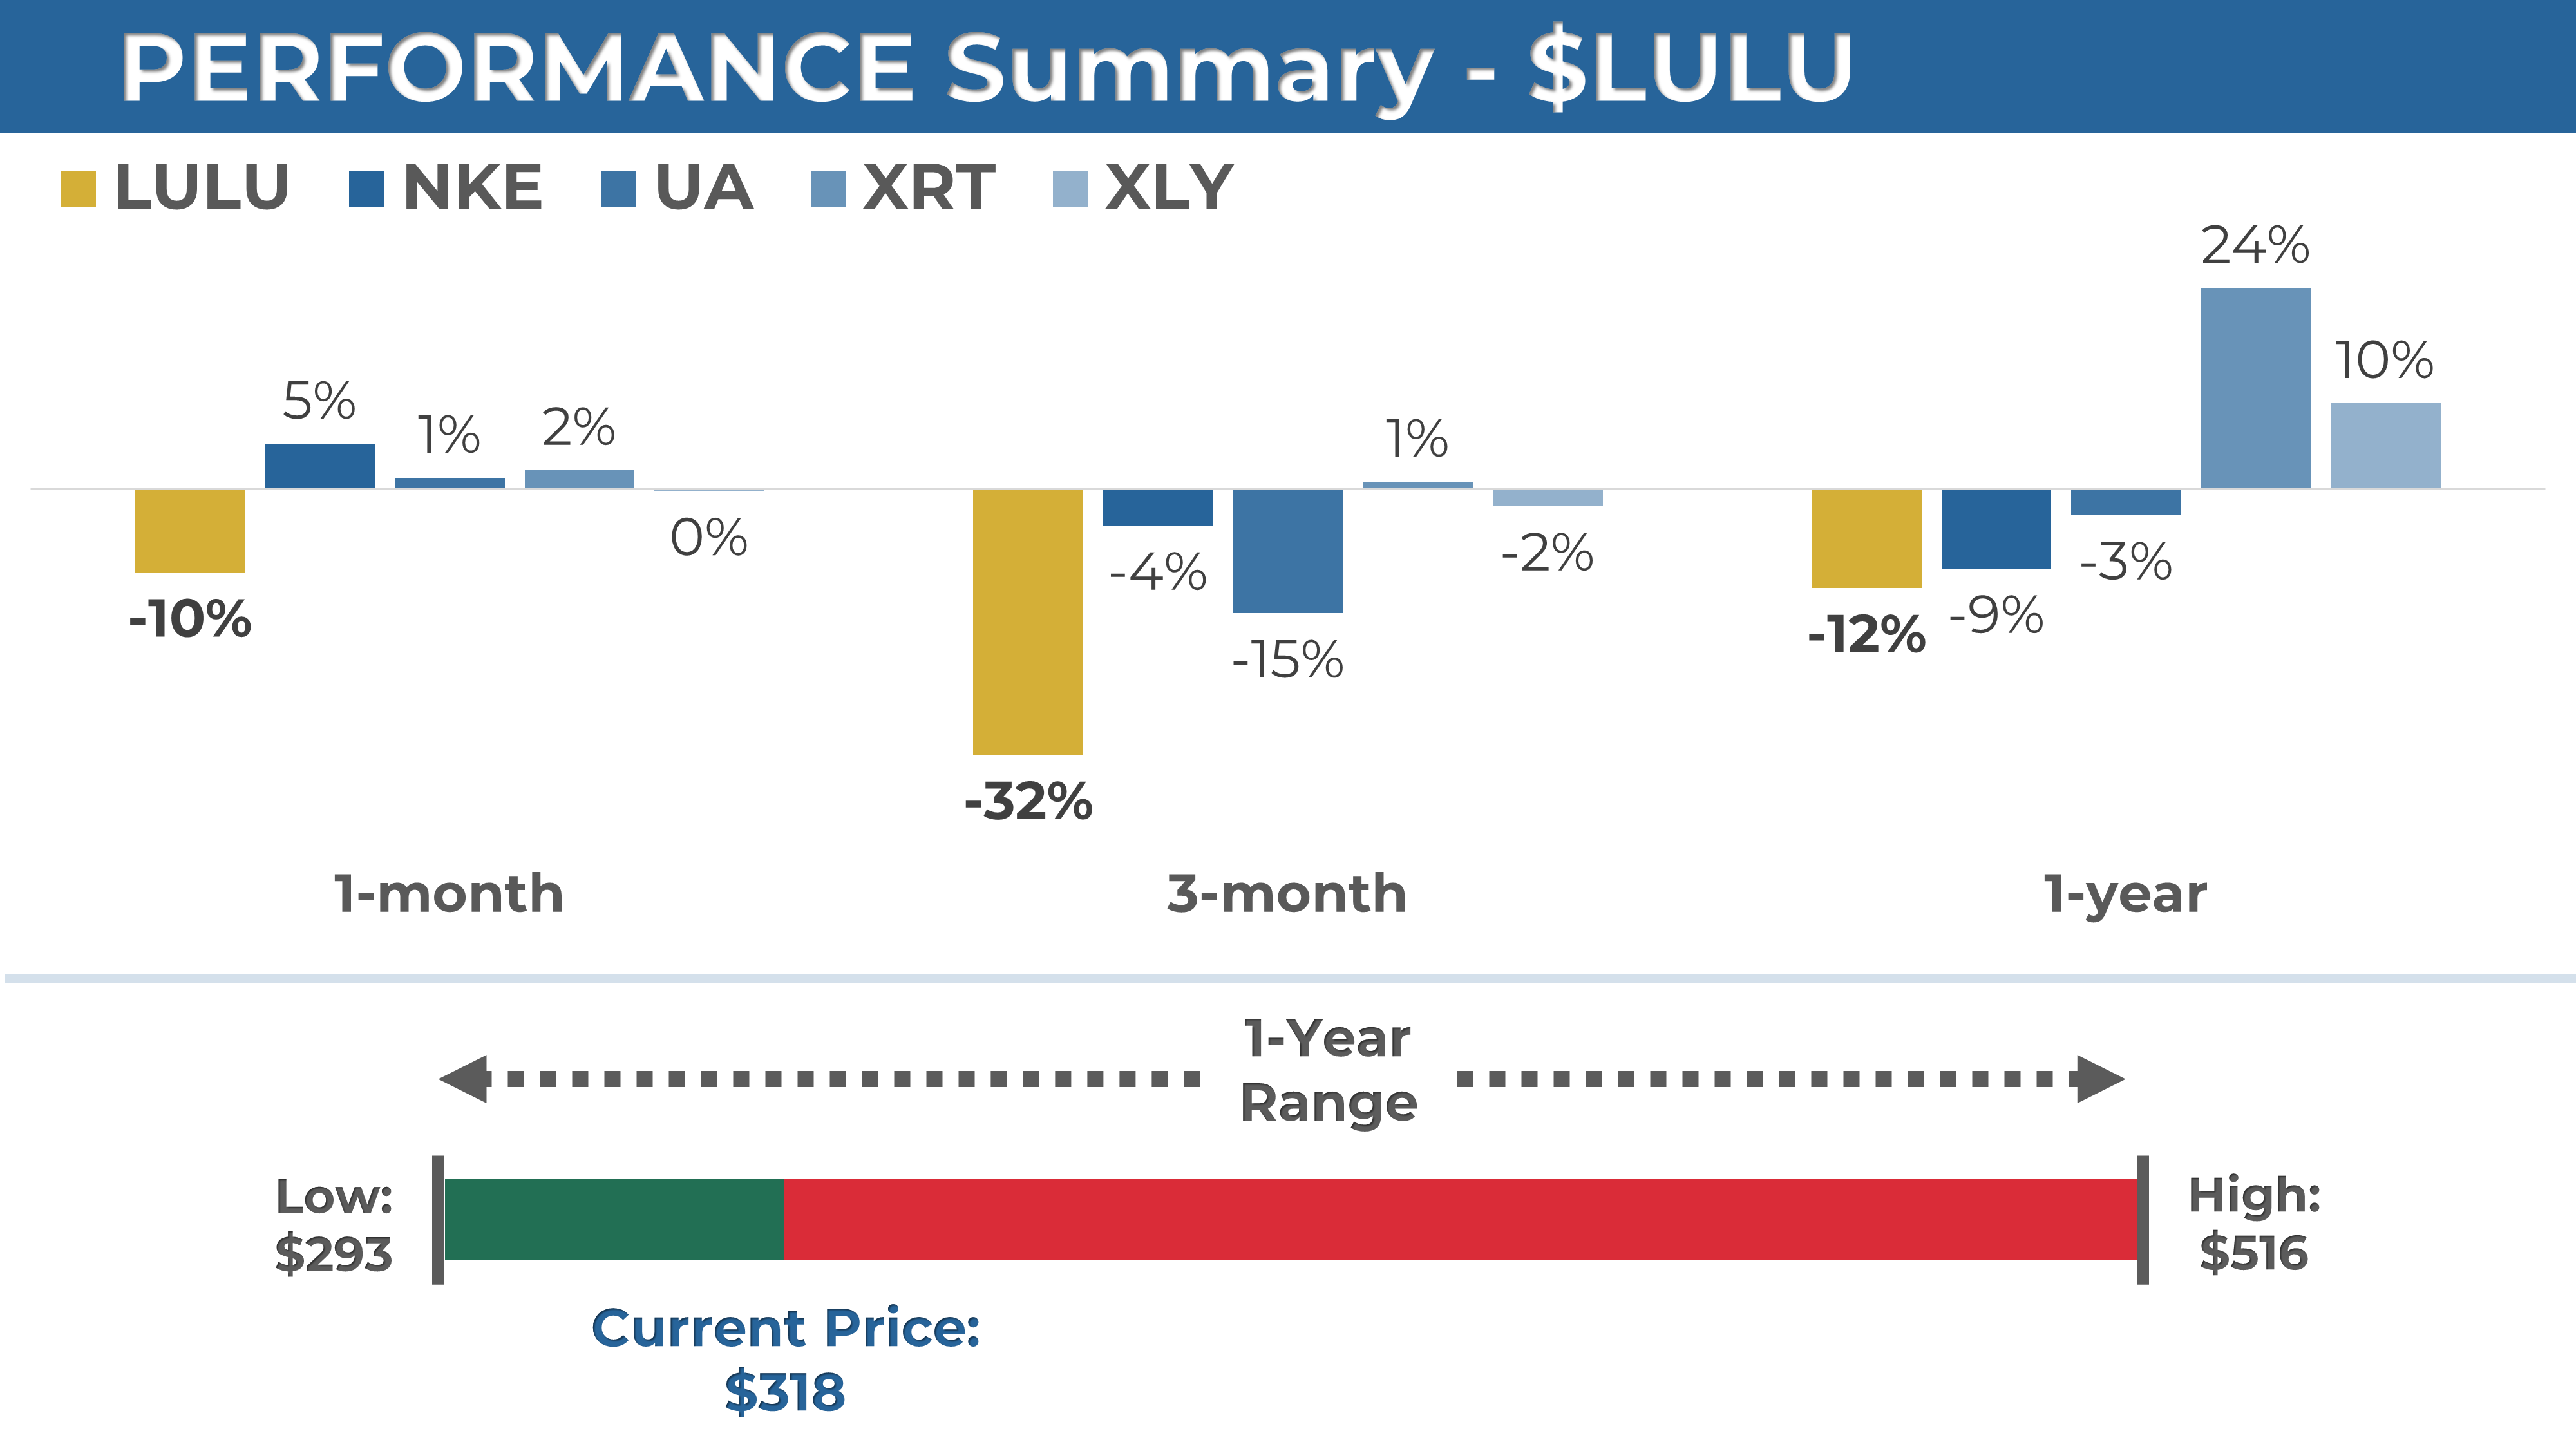
I used the following benchmarks:
Nike (NKE)
Under Armour (UA)
SPDR Retail ETF (XRT)
Consumer Discretionary Sector (XLY)
Trend
Weekly chart: Weak
Lululemon is trading below its 9-week (blue line in my chart) and 30-week (gold line) exponential moving averages, both of which are trending downward. Although last week's post-earnings jump was a positive step toward a potential reversal, we are still far from calling this a bullish chart.

Daily chart: Mixed
The daily chart looks more attractive as we might soon see a bullish signal where the 9-day EMA (blue line) crosses over the 21-day EMA (gold line). Moving average crossovers are typically bullish and could indicate that the rally from the lows has just begun. I would also like to see this crossover on the weekly chart in the future.

Key Levels (and % vs. current price)
Support:
$290 (-9%)
$250 (-21%)
$210 (-34%)
Resistance:
$370 (+16%)
$450 (+41%)
$516 (+62%)
$290 was the bottom before earnings, and ideally, we won’t revisit that level. If it breaks, we should see a bounce around the $250 area, a strong multi-year support.
If bulls follow through, the first test will be $370, which we failed in April, triggering the last leg down. Once cleared, the next natural target would be to fill the March earnings gap, up to $450. The ultimate target is the previous high at $516, but reaching that will require patience.
My View: Attractive Long-Term Setup In Formation, But Needing Further Confirmation
Lululemon is the type of high-quality company I aim to invest in for my long-term portfolio, and it has been on my watchlist for months. After (unfairly?) selling off for most of 2024, we finally see some early signs of a bottom. However, it's still too early for me to adopt a fully bullish stance; I need more evidence that the lows are in. Notably, with the stock still trading below the 30-week moving average—a critical long-term trend line—I can't be fully confident the pullback is over. We actually experienced a similar situation in mid-April, where an initial recovery had no follow-through and led to another leg down. This is why I prefer to remain patient, even at the risk of missing the early stages of the rally. In my view, once the momentum shifts positive, the upside potential will be substantial.
Our final conclusion
This post should show that we both view Lululemon as a high-quality company. However, identifying good companies is only the first step. Equally important is ensuring entry at an attractive price and with a setup that offers a favorable risk-reward profile. The fundamental analysis from Daan Rijnberk suggests an attractive valuation at these levels and a favorable risk-reward profile. Technical analysis from My Weekly Stock suggests we may have found a bottom. Still, it is wise to be more patient for further confirmation that momentum is turning positive.
We aimed to provide you with an unbiased, data-driven analysis of Lululemon. We hope you gain insights into our approach and see how fundamental and technical analysis can complement each other. However, the decision to invest is very personal and depends on many factors. We strongly encourage you to do your own research and form your own opinion. While we can serve as your compass to navigate the market, the journey is ultimately yours to take!
If you enjoyed this format and would like to see similar posts in the future, please hit the like button, share your comments, and be sure to subscribe to
and .Disclosure: I/we may or may not have a beneficial long position in any of the securities discussed in this post, either through stock ownership, options, or other derivatives. This article expresses our own opinions, and we are not receiving any sort of compensation for it.
No recommendation or advice is being given as to whether any investment is suitable for a particular investor. The information provided in this analysis is for educational and informational purposes only. It is not intended as and should not be considered investment advice or a recommendation to buy or sell any security.
Investing in stocks and securities involves risks, and past performance is not indicative of future results. Readers are advised to conduct their own research before making any investment decisions.
 | A guest post by
|
What a fall from grace on this one, even though all I see on a weekend afternoon walking in the city is women in their LULU’s!
Great analysis! Is there a catalyst event in the near future that might unlock this value?